Case Study 01 · Industrial IoT

Energy Asset Monitoring Platform

Designing proactive power systems intelligence for high-stakes enterprise operations.

Role
Lead Designer — End-to-End Design
Domain
Industrial IoT · Energy & Utilities
Duration
130 weeks
Tools
Figma, Adobe XD, Miro, Google Form, MS Teams
Overview

The strategic frame

I designed the interface where a grid engineer decides whether to trust what an automated diagnosis just told them about a transformer they cannot see — and is held accountable for that decision either way.

Duration

130 weeks

Scope

216 screens and states

Roles served

4 distinct operator types

Research

B2B, via proxy users

Diagram mapping human oversight of automation, fragmentation-to-platform, and multi-stakeholder design to an AI-agent steering layer, content fragmentation, and multi-sided distribution
Why this domain transfers: the same human-oversight-of-automation problem, applied to a different industry.
Problem

The problem and its stakes

Energy operators managing transformer fleets across geographies had no unified view of asset health. Processes were siloed, raw sensor data was hard to interpret, and the consequences compounded: performance issues were detected late, maintenance stayed reactive, compliance reporting consumed time, and there was no way to model what-if scenarios for risk planning.

What was at stake

Unplanned downtime costs large industrial facilities an average of $129M a year (Siemens, True Cost of Downtime, 2022). That is the industry context this platform was built to reduce — not a measured result of this project.

Why it was hard

Four roles, one product

Operators need instant situational awareness. Maintenance technicians need diagnostics and history. Managers need fleet-level strategy. Engineers need deep technical analytics. A single generic view would serve none of them; four separate products would fragment the shared truth operators most need to trust.

The system advises about physical equipment, and it can be wrong

The platform computes suggested fault diagnoses from dissolved-gas ratios against published standards. An engineer who follows a wrong recommendation damages equipment; one who dismisses a correct one risks failure. The interface sits directly on that judgement.

No direct access to end users

As a B2B platform, research ran through Product and Project Managers and domain experts who worked with customers. That is a real limitation, and it shaped how much weight to put on early assumptions versus what testing later confirmed.

Research

Evidence under constraints

Quantitative

Structured questionnaires distributed to selected customers on functionality and expectations, coordinated through the PMs who held the customer relationships.

Qualitative

Discussions with PMs and domain experts on recurring pain points, usability challenges and feature-adoption issues — proxies for users I could not reach directly.

Usability testing

Remote moderated sessions with proxy users across four task scenarios: check equipment health, respond to an alarm, review historical analytics, generate a compliance report.
What worked

  • Central dashboard and real-time multi-device view were valued
  • Alarm acknowledgment flow was straightforward and reduced response time
  • Reporting and export were highly valued for audits

What didn't

  • Users struggled to locate specific device data — navigation needed clearer information architecture
  • Analytics graphs were too data-heavy and needed simplification
  • Report customisation was too limited — users wanted filtering by date and asset
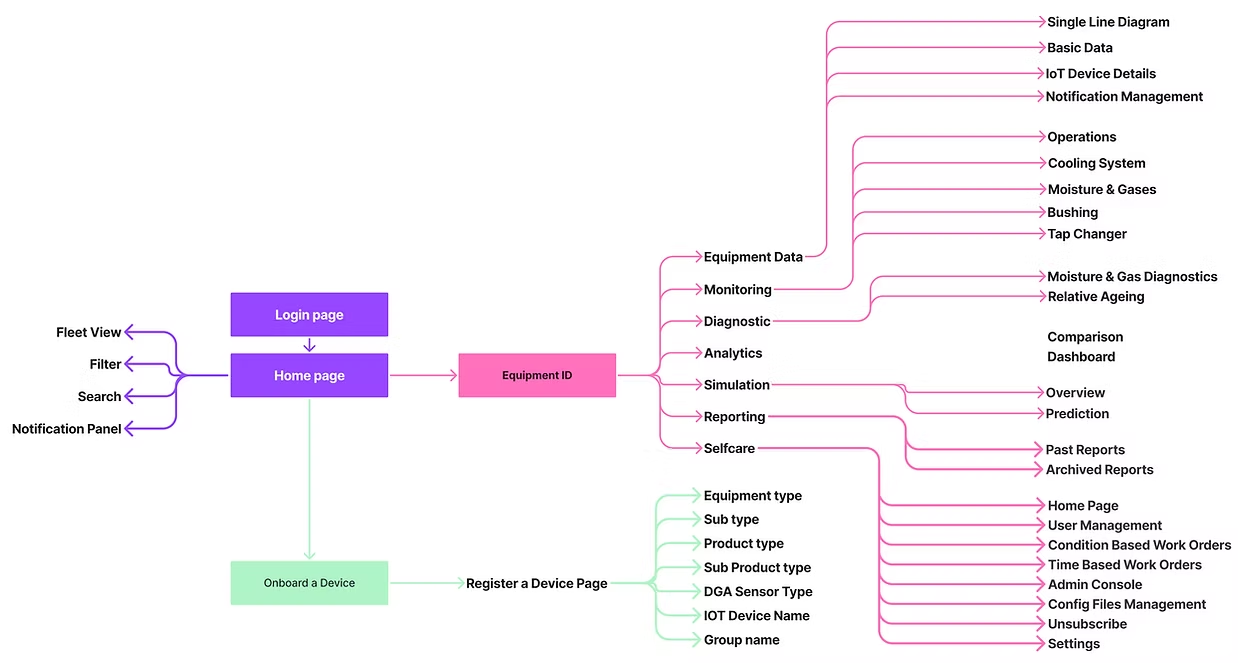
Information architecture diagram covering login, home, equipment, monitoring, diagnostics, analytics, simulation, reporting, and selfcare
Information architecture mapping the platform’s core navigation and content model
Personas

User landscape

Power Systems Operators

Real-time
Context
Control room environments, 24/7 operations
Needs
Instant situational awareness, critical alert prioritisation
Goals
Quickly identify high-risk assets requiring immediate attention
Challenges
Information overload, time-critical decisions
Success metrics
Response time, situational awareness accuracy

Maintenance Teams

Predictive
Context
Field operations, mobile access, power electronics expertise
Needs
Early fault detection, maintenance planning optimisation
Goals
Shift from reactive to predictive maintenance strategies
Challenges
Resource allocation, service planning complexity
Success metrics
Maintenance efficiency, equipment uptime

Managers & Planners

Strategic
Context
Executive environments, strategic planning sessions
Needs
Fleet-wide health insights, environmental impact understanding
Goals
Optimise asset utilisation, allocate resources strategically
Challenges
Balancing operational cost with performance
Success metrics
Asset utilisation, strategic goal achievement

Power Electronics Engineers

Analytical
Context
Engineering workstations, complex analysis workflows
Needs
Load flow simulation, fault location, weather risk assessment
Goals
Energy distribution optimisation and system balancing
Challenges
Complex data analysis, multi-variable optimisation
Success metrics
Grid stability, distribution efficiency
Design judgement

Decisions under constraint

01

Accountable Alarm Dismissal

Problem

Operators face high alarm volume, so dismissal must stay fast — but a silently dismissed alarm on critical infrastructure is an accountability gap.

Solution

Notifications move through New → Noted → Disregarded, and marking one disregarded requires a written reason. The record then shows who disregarded it, why, and when.

Result

Dismissal stays quick but stops being invisible — the system captures human judgement rather than discarding it.

Flow diagram showing alarm states from New through Noted to Disregarded, with a retained record of who dismissed it, why, and when
The New → Noted → Disregarded flow, with a mandatory reason and retained record on dismissal.
02

Advisory Diagnostics, Not Automated Verdicts

Problem

Dissolved-gas analysis can reveal developing faults, but interpretation is expert work grounded in published standards. Automating the decision would be inappropriate; showing only raw ratios would waste the analysis.

Solution

The platform computes gas ratios and presents a Suggested Fault Diagnosis alongside the underlying ratio values and the standard it derives from (IEEE Std C57.104-2019, ICDL 1999).

Result

Engineers can evaluate the reasoning rather than accept a verdict — transparency about why is what makes the recommendation trustworthy.

03

Expert Override With Stated Risk

Problem

Siemens recommends monitoring thresholds, but site conditions vary and engineers legitimately need to adjust them. Locking them would be wrong; allowing silent changes would be unsafe.

Solution

Thresholds are adjustable with explicit upper and lower values, and deviating from recommended values surfaces a direct warning that doing so, or relying on monitoring with inaccurate parameters, may negatively affect the equipment.

Result

Expert authority is preserved and the consequence is stated at the moment of decision rather than buried in documentation.

04

Role-Based Dashboards

Problem

Four stakeholder groups had different priorities competing within one interface.

Solution

Designed four dashboard variants — Operator, Maintenance, Manager, and Engineer.

Result

Reduced cognitive load by showing each role the information most relevant to its work.

05

Geospatial Visualization

Problem

Distributed asset health was difficult to understand quickly.

Solution

Introduced an interactive map with status color-coding and heat maps.

Result

Faster situational awareness across the fleet.

06

Alert Prioritization

Problem

Teams faced 100+ daily alerts without a clear way to focus.

Solution

Introduced severity levels and smart filtering.

Result

Critical alerts became easier to identify and act on.
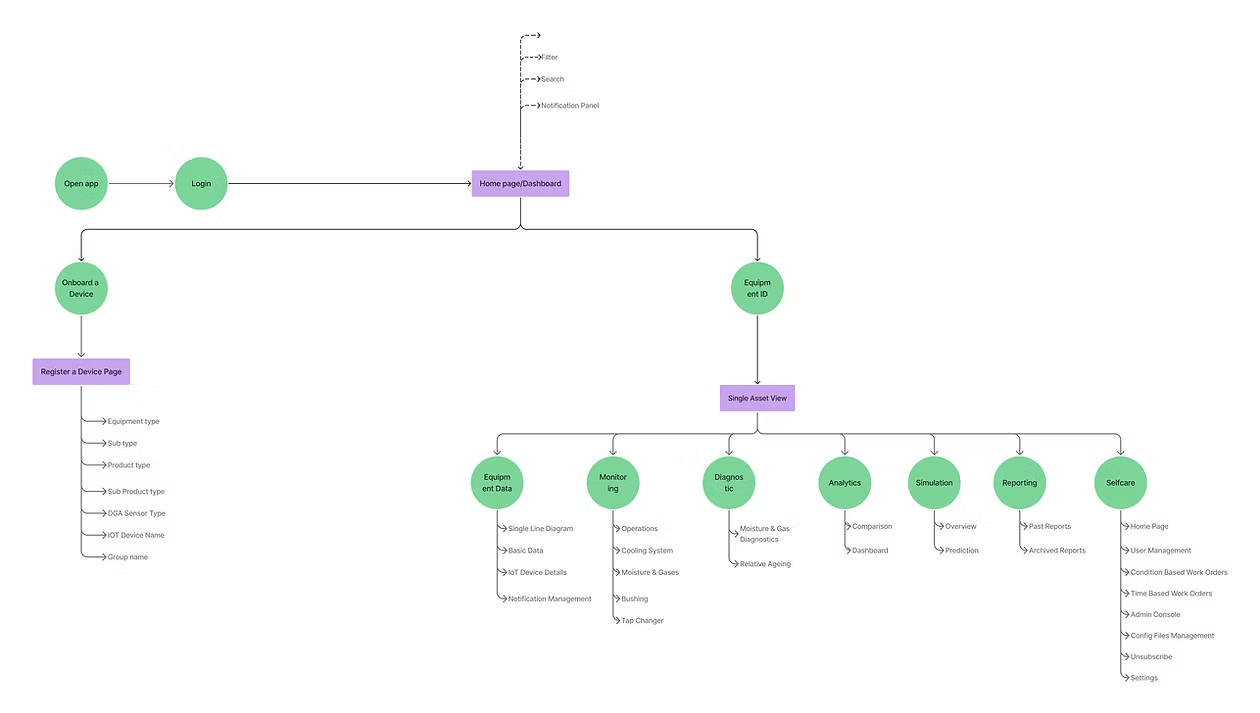
User flow diagram from app open and login through home, onboarding, register device, and single asset view
User flow connecting device onboarding, alert handling, and the single-asset dashboard
07

Customizable Dashboards

Problem

Fixed dashboards could not support the priorities of every team.

Solution

Added user-configurable widgets and layouts per team.

Result

Each team could tailor monitoring to its workflows without fragmenting the platform.

08

Real-Time Updates Without Disruption

Problem

Live data refreshes could interrupt attention and create jarring interface changes.

Solution

Used a 5–10 second refresh with smooth animation.

Result

Information stayed current without disrupting users' focus.

Impact

Business outcomes

  • 4 distinct roles served from one information architecture
  • Maintenance model shifted from reactive to predictive across the fleet
  • Accountability built into overrides — every dismissal carries a reason and an author
  • Advisory, standards-based diagnostics rather than opaque automated verdicts
  • 3 siloed dashboards consolidated into 1 unified platform

Downtime cost figures cited above are industry benchmarks (Siemens, 2022), not measured project results.
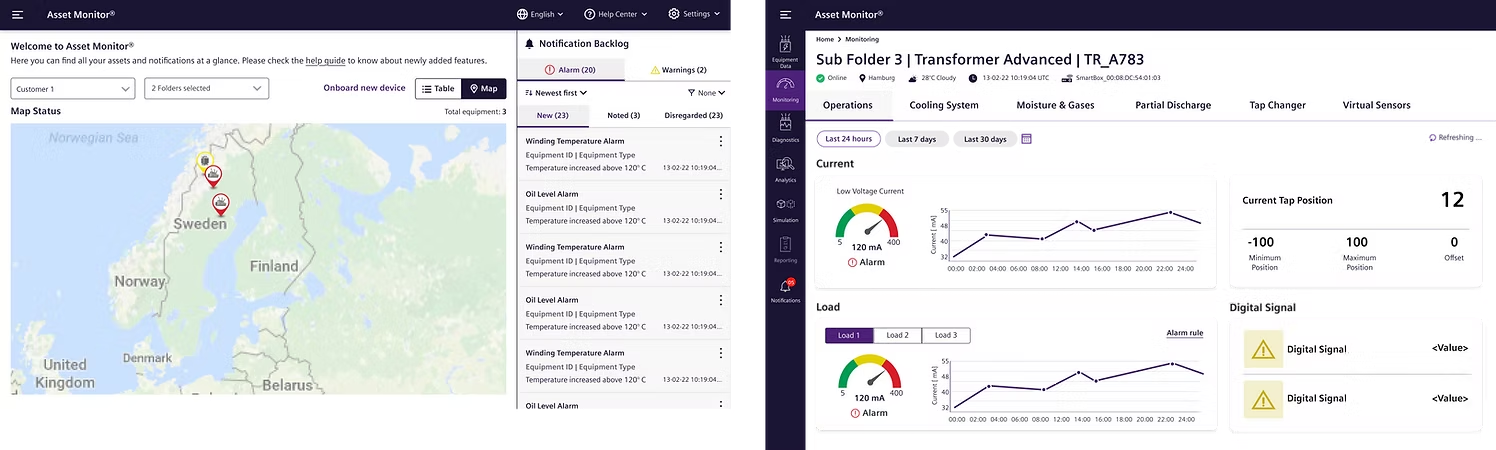
Product UI showing asset map, alarm backlog, and single asset detail dashboard
Final product interface combining the geographic asset map, alarm backlog, and single-asset dashboard
Reflection

What I would carry forward

The strongest thing about this project is not the dashboards — it is that the design took a position on where automation stops. The platform computes, suggests and warns; it never decides. Every consequential action leaves a human name attached to it. That principle came from the constraint rather than in spite of it: without direct access to end users, I could not design on assumption about how operators would behave. Making the system's reasoning visible and every override attributable was the safer architecture — and the one that held up in testing.

What came next
  • Navigation and IA simplification following usability findings
  • Simplified analytics visualisation to reduce data density
  • Expanded report filtering by date and asset
Strategic impact

Design Leadership

  • Led design end-to-end as the lead designer, partnering with product, business, and development teams
  • Aligned conflicting stakeholder priorities into a shared strategy
  • Established design standards adopted across multiple platform initiatives
Strategic impact

Executive Influence

  • Presented platform strategy to C-level executives and business unit leaders
  • Translated UX requirements into business value propositions
  • Influenced product roadmap and strategic investment decisions
Strategic impact

Innovation Leadership

  • Pioneered a geospatial, real-time visualization approach for enterprise power systems monitoring
  • Established design patterns influencing future platform development
  • Pioneered a geospatial analytics approach later referenced in adjacent platform work.
Next case study

SIMIT Rapid Tester — Engineering Automation Platform

Get in touch

Discuss a role or project